Handy Links
SLAC News Center
SLAC Today
- Subscribe
- Archives: Feb 2006-May 20, 2011
- Archives: May 23, 2011 and later
- Submit Feedback or Story Ideas
- About SLAC Today
SLAC News
Lab News
- Interactions
- Lightsources.org
- ILC NewsLine
- Int'l Science Grid This Week
- Fermilab Today
- Berkeley Lab News
- @brookhaven TODAY
- DOE Pulse
- CERN Courier
- DESY inForm
- US / LHC
SLAC Links
- Emergency
- Safety
- Policy Repository
- Site Entry Form

- Site Maps
- M & O Review
- Computing Status & Calendar
- SLAC Colloquium
- SLACspeak
- SLACspace
- SLAC Logo
- Café Menu
- Flea Market
- Web E-mail
- Marguerite Shuttle
- Discount Commuter Passes
-
Award Reporting Form
- SPIRES
- SciDoc
- Activity Groups
- Library
Stanford
Around the Bay
Data Mining Meets Black Magic
Whether they work in physics, biology, medicine, business intelligence or financial analysis, groups around the world are searching for hidden structures in large data sets. Deducing meaning from these sets can be very, very difficult—perhaps as difficult as, say, quantum mechanics. Now, using the advanced mathematics of particle physics, SLAC theorist Marvin Weinstein and Tel Aviv University theorist David Horn have created a completely new method by which large data sets can be mined for structure and specific information.
"When you're recording tons of data, knowing how the things you measure relate to what you actually want to know gets complicated," Weinstein said. "I originally developed the quantum mechanics techniques used in the data mining algorithm as a way to better understand complex relationships in quantum mechanics, quantum chemistry and field theory. The application to data mining was a bonus."
One example of a data mining problem comes from the world of air travel. Airplane manufacturers regularly track all maintenance done on their planes. Suppose a pilot discovers that something is wrong with her plane. A mechanic deduces that the problem is with one of four parts. The airline decides to replace all four parts to get the plane in the air again as quickly as possible—and so lose as little money as possible. The airplane manufacturer puts all of this information into a database and, after compiling all such data over the course of several years, wants to find information hidden in the numbers. Which parts are regularly replaced? Of those, which are most likely to have actually been broken? Why might they have broken? And what would be the optimum suggested lifetime of each part?
Nearly all previous data mining algorithms take this type of data set and plot it with the dimension in which the data spread is the largest along the x-axis, the second-largest along the y-axis, and so on. The clustering algorithms then guess at the number of clusters, or natural groupings, hidden in the data and choose one data point to represent each cluster. They then gather the remaining data points with the nearest cluster locus point, thereby hoping to find the hidden clusters or structures.
In contrast, Weinstein said, "our method is totally different from everything else that exists. We do something a little bit bizarre."
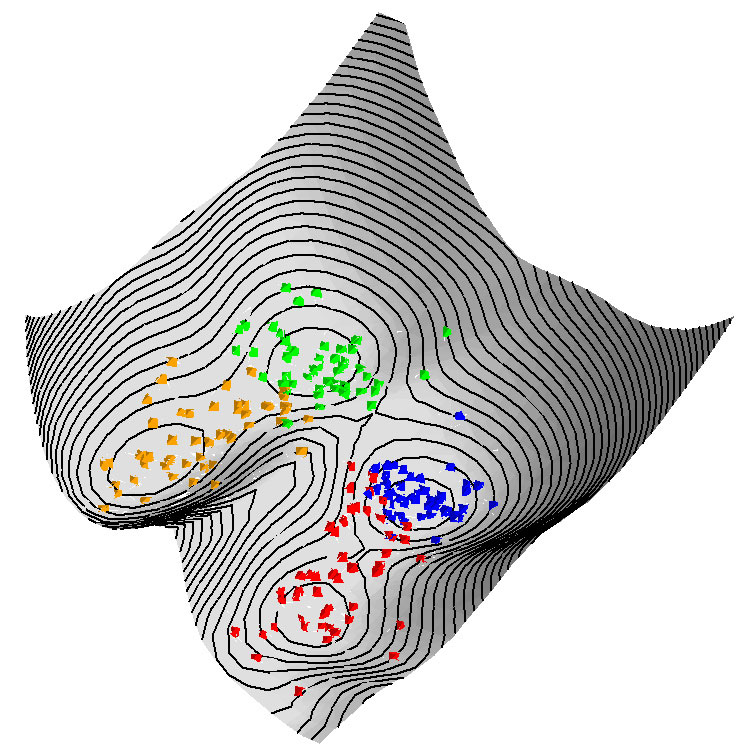
Weinstein and Horn's method uses some advanced mathematical tricks to remove the guesswork inherent in previous methods. Their algorithm, like previous ones, starts with a large amount of data with many variables; using that data, the algorithm constructs a "potential function" for a related problem in quantum mechanics. This function, which is a continuous surface in many dimensions, can be visualized as a landscape with hills and valleys. The surprising thing is that the valleys of the potential function capture the locations of clusters in the original data. Then all that is left is to identify which points lie in the same valley when the dimension (i.e. the number of variables measured) is large and when one is dealing with many data points.
That, it turns out, is not as easy as it sounds. Working with other collaborators, Horn previously treated this as a problem in classical mechanics, rolling each point down the hill and into the valley. He found that, when the number of variables is large, there is a tendency for this to produce many small clusters—too many clusters in fact, creating structure where none actually exists.
To avoid this over-complexity, Weinstein and Horn's dynamic quantum clustering algorithm uses another approach taken from the quantum mechanics playbook: it treats this landscape not as a physical surface, but as the potential function in a many-dimensional Schrödinger equation, and treats each data point as a wave-function whose "center" is located at the original coordinate values. "All that remains is to let this wave-function evolve in time," Weinstein said. The center of the packet will almost roll down the hill the same way as in the classical problem. (The neat thing is that the quantum correction is what is needed to allow data points which lie in the same big valley, but which would classically get trapped in small irregularities in the surface, to merge, ensuring that the algorithm doesn't create too many clusters.)
"So, we just roll the data points down the hills into the troughs, and we've got our clusters," Weinstein said. "The quantum mechanics is well understood, although the construction of the potential function is pure black magic; there's no theory that says this method should work, but it does."
Weinstein's not kidding when he says it works; the algorithm usually scores high on the Jaccard test, which measures how well an algorithm correctly clusters data. "There are problems on which other programs do better, and ones on which other programs do worse. But we consistently do as well as the others when the others work well," Weinstein said.
Weinstein calls the algorithm a "multipurpose Swiss Army Knife" because it doesn't care about the type of data, the number of clusters or the number of variables in a data set. It just computes—and, because it can be set up to run on several processors at once, it computes quickly.
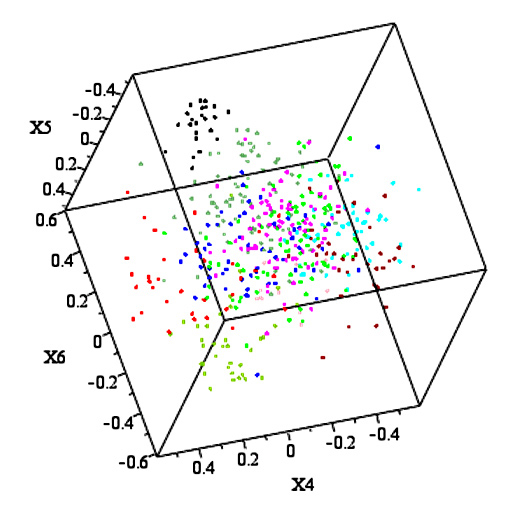
The real strength of the method, Weinstein said, is that it is highly visual. Using Maple, a commercial computer algebra system, Weinstein wrote a program that not only runs the algorithm, but then displays the evolution of the data using 3-D graphics on a user's screen. The user can watch the data points migrate closer and closer together until they become tightly clustered. This aspect of the process makes it well suited to interactively exploring possible structures in large data sets.
"I feel lucky to be part of a theory department that allows us to take ideas in completely new directions," Weinstein said.
—Kelen Tuttle
SLAC Today, February 26, 2009